
Student Growth Measures for Accountability: No, You Don’t Need a Vertical Scale

And Gain Scores Only Tell Part of the Story about Student Growth
The claim that a vertical scale is necessary when calculating student growth measures for school accountability systems has resurfaced. In this post, I discuss why a vertical scale is NOT required to measure growth. In fact, I argue, as others before me have, that vertical scales obfuscate growth, leading to distortions and misunderstandings. I’m hoping that a few examples might help make this point clear.
When Considering Student Growth Measures, Let’s First Ask: What is Growth?
Before talking about student growth measures, it’s worth defining growth in contrast to status and improvement, which are the other common ways of describing school performance in accountability systems (see Castellano and Ho, 2013):
- Status: The academic performance of a student or collection of students at a single point in time.
- Improvement: The change in performance over time within grades or across grades without following the same student or collection of students.
- Growth: The academic performance of the same student or the same collection of students over two or more points in time.
Growth Moves From Optional to Required: Beyond Proficiency in State Accountability Systems
Accountability systems have evolved since the days of No Child Left Behind and simple tabulations of the percentage of proficient students, but still focus predominantly on academic outcomes. As annual testing began under NCLB, the U.S. Department of Education (2005) invited states to participate in a growth model pilot to account for students who were on track to becoming Proficient. Student growth was written into Accountability Regulations in 2008 to “improve the validity of AYP [Adequate Yearly Progress] determinations.” Currently, nearly all states use growth as the additional academic indicator required by the Every Student Succeeds Act.
States adopt various growth models based on local policy goals, technical requirements, desired interpretations (which can vary significantly), and local levels of state capacity (see D’Brot, 2017).
In this post, I will focus on the one growth model that does require the use of a vertical scale: gain scores. Using gain scores, growth is defined as the difference between two test scores on a common (i.e., vertical) scale.
Gain scores were once a commonly-used approach to measuring growth and as described by Castellano and Ho (2013) are a “simple, accessible, and intuitive approach that primarily supports growth description.” However, just because an approach is common and simple doesn’t make it good.
How Do Vertical Scales Work?
Scales for state summative assessments seek to quantify the achievement of a student who demonstrates certain knowledge, skills, and abilities on the state’s academic standards. Psychometricians build scales using structured and systematic processes. In the example below, these processes yield grade-level scales that range from 200 to 400. Standard setting procedures are used to identify markers of performance along the scale.
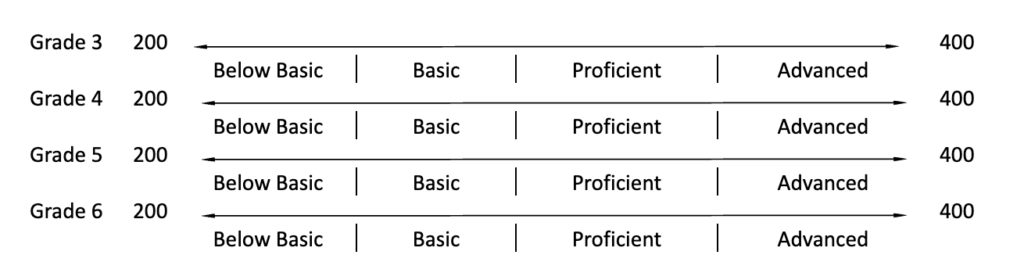
In the example above, scales across grades are independent of one another. In the example below, using the grade 3 scale as the base, those individual scales are linked vertically across grades in an attempt to quantify the change in learning that happens from grade to grade.
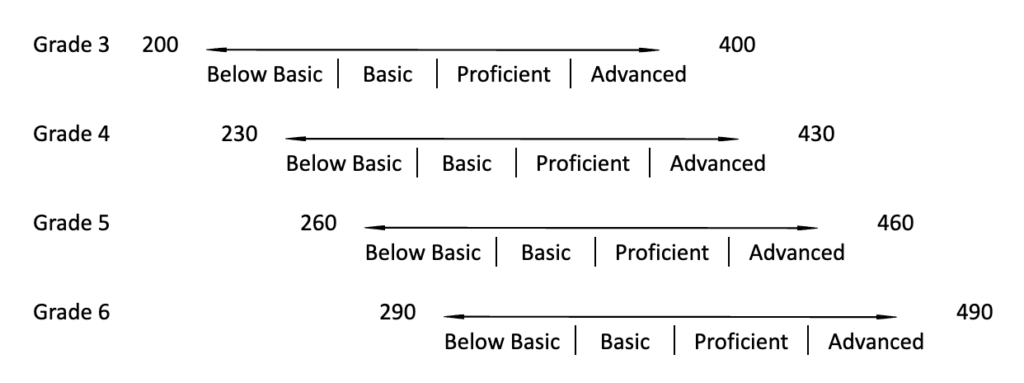
The result is a single vertical scale linked across grades that ranges from 200 to 490. The vertical scale is conceptualized as continuous, and ostensibly allows you to subtract a score at a previous grade from a student’s current score to compute a gain score that quantifies how much growth a student has made over time.
The gain score approach to computing growth makes several assumptions that have been questioned. I’ll focus on three:
- The distance between steps on a vertical scale is equally spaced,
- The difference between two points on the vertical scale is interpretable, and
- Gain scores contextualize student growth.
Assumption 1: The Distance Between Steps on a Vertical Scale is Equally Spaced
When the distance between steps, or intervals, on a scale is equally spaced, we refer to it as an interval scale. Whether vertical scales qualify as interval scales is open to debate.
Over the years, there have been several critiques of the interval nature of vertical scales (see Hoover, 1984, Clemans, 1993; Phillips & Clarizio, 1988), with several rebuttals presented (Yen, 1985; Yen et al., 1997). For a great discussion of some current use cases and how to investigate vertical scales, see Derek Briggs’ (2013) discussion on vertical scales.
Assumption 2: The Difference Between Two Points on the Vertical Scale is Interpretable
Even if we accept that vertical scales represent equal “steps” along the way to proficiency, how do you interpret them? When investigating the meaning of a scale, I question whether the interval nature of vertical scales, or scales in general, has any bearing on its interpretability.
Let me offer an example (grounded in my own experiences and preferences, of course) that highlights the difficulty of interpreting scales, even equal-interval scales.
Weather and the Challenge of Interpreting “Well-Known” Scales
I, like many of the folks at the Center, check weather forecasts religiously (we travel a lot). For me, it’s meditative as well as informative. When I work at home, I will likely have Weather Underground in the background. Something is calming about meteorologists over-interpreting weather information to predict everything from the mundane to the crazy.
To get back to interpreting scales, does a spot that is 80° F have double the number of degrees as a nearby spot that is 40° F? Yes, because temperature scales are interval, meaning they have equal spaces between adjacent values.
Is the spot that is 80°F twice as hot as the 40° F spot? No. An interpretation such as “twice as hot” is reserved for scales that have a true zero, like weight, height, or the Kelvin temperature scale. We refer to those scales as ratio scales.
Are there days when 80° F feels twice as hot as 40° F? Maybe, on some days and to some people. But what about 80° F and 100° F? For sure, 100° F is not double 80° F, but a lot of people would say 100° F feels at least twice as hot.
The same applies to the difference of 5° F and 10° F degrees (i.e., double the degrees but twice as hot? It doesn’t matter; as a friend of mine says, “Any single-syllable temperature is just misery.”
Not convinced yet? Let’s leave the extreme cold weather behind and return to our original 40° F and 80° F locations. On the Celsius scale, also an interval scale, the very same temperatures would be 4° C and 27° C, respectively. Twice as hot or six times as hot? 40 degrees warmer or 23 degrees warmer?
Assumption 3: Gain Scores Contextualize Growth
As I stated above, growth should help us better understand the quantity and quality of change in student learning from one point in time to another. Let me offer another example to demonstrate how gain scores fail to meet this requirement.
If you’ve read any of my previous posts, you’ll know that I enjoy helping my son establish good habits while having fun along the way. Relatedly, my son got into running a couple of years ago through the cross country team, so we get an opportunity to run together. As we make our way through winter, track season is quickly approaching, which means that I get to drag him back out to the trails to build up some endurance. Recently, he became very excited that he was able to knock off 2 minutes on his mile pace. Is 2 minutes a lot?
Two minutes means something very different if you average a 10-minute mile or if you average a 6-minute mile. According to the marathon handbook, a beginning male runner in his 30s should run just under a 10 minute mile and an elite runner is approaching a 5 minute mile. At the high school level, the difference between a 4-minute and 6-minute pace may separate the very competitive male cross country runners from the back of the pack. Clearly, the quantity of 2 minutes is the same thing in each case but means very very different things depending on where you are on the scale of running.
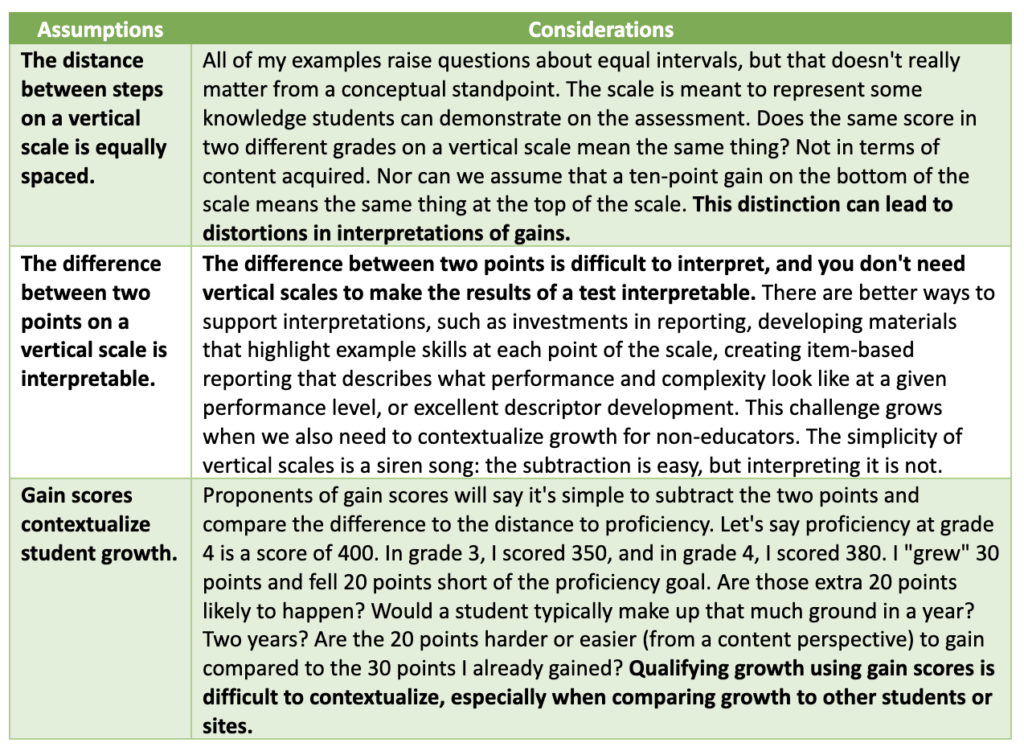
Summarizing the Considerations for Estimating Growth
Let’s summarize the three assumptions about gain scores.
Interpreting Vertical Scales and Gain Score on State Assessments
Scale scores from state summative assessments do not have a well-known set of values—they are derived and transformed into a scale to which we assign meaning. States regularly engage in standard setting to specify a minimum amount of content that reflects the knowledge, skills, and abilities that students are expected to demonstrate at multiple benchmarks along the individual grade-level scale (e.g., Below Basic, Basic, Proficient, and Advanced).
Any state assessment staffer or assessment contractor is familiar with the challenges of building public capacity to interpret these scales. A single grade-level scale can be challenging enough to interpret. Connect scales across grades 3 to 8, and you can quantify the qualitative improvements in learning that happens from grade to grade. Whether the quantification is justifiable, it does not obscure the fact that vertical gains are difficult to interpret, and vertical scales are not necessary to estimate growth.
Vertical Scales May Complicate Interpretations of Growth
While the assumptions about gain scores can be debated, I want to conclude where I started: A growth estimate can be derived without vertical scales and, when done well, can provide vastly more information and context that reflects student growth.
My colleague Damian Betebenner has written extensively on how Student Growth Percentiles (SGPs), a normatively based growth model, can be applied to inform criterion-based judgments (i.e., how much growth is needed to meet the standard) and can be used to monitor improvements over time (i.e., using baseline-referenced SGPs to determine whether students and schools are improving compared to prior growth rates). That refutes many arguments about the risks of norm-referenced data as it can still provide a criterion-referenced interpretation.
As I noted, there are many growth models to choose from, and some do certain things better than others. They support different interpretations, and all have different benefits and risks. Regardless of the approach taken, I hope you and other readers come away with the understanding that vertical scales are not necessary to calculate student growth estimates.