Understanding Root Causes of Misalignment Between Results from Different Assessments

Applying principled assessment design to the interpretation of results
The recent release of 2022 State NAEP results shone a bright spotlight on the need to provide guidance to policymakers and educators on how to interpret the seeming misalignment between results from different assessments. In this post, I briefly review what the professional literature and experiences around principled assessment design can teach us about the root causes of such divergences.
During the presentation and panel discussions that followed the NAEP public release, several panelists talked about the necessity to have effective lines of communication between parents, teachers, and students about these results to ensure that all parties have a common understanding of the current state of learning and become equally invested in ensuring the success of their students.
What We Can Learn from Different Assessments and Accountability Indicators
One of the reasons why such conversations can be difficult to have is the confusion and misunderstanding caused by the seeming misalignment of results about learning from different assessments and accountability indicators in the overall information ecosystem.
For example, the assessment ecosystem typically includes national educational surveys such as NAEP, state summative and interim assessments, diagnostic or benchmark assessments, digital learning and assessment environments, district-created assessments, and formative classroom assessment practices.
The accountability ecosystem includes the scores or classifications from some of these assessments but then also information about progress on English language proficiency, graduation, school quality, and other locally relevant indicators.
All of the indicators that feed into the assessment and accountability ecosystems have different purposes and underlying designs, which makes it reasonable to expect alignment in the overall narrative but divergences in finer-grained details when one takes a closer look at what is measured, how it is measured, and what the measurement is for.
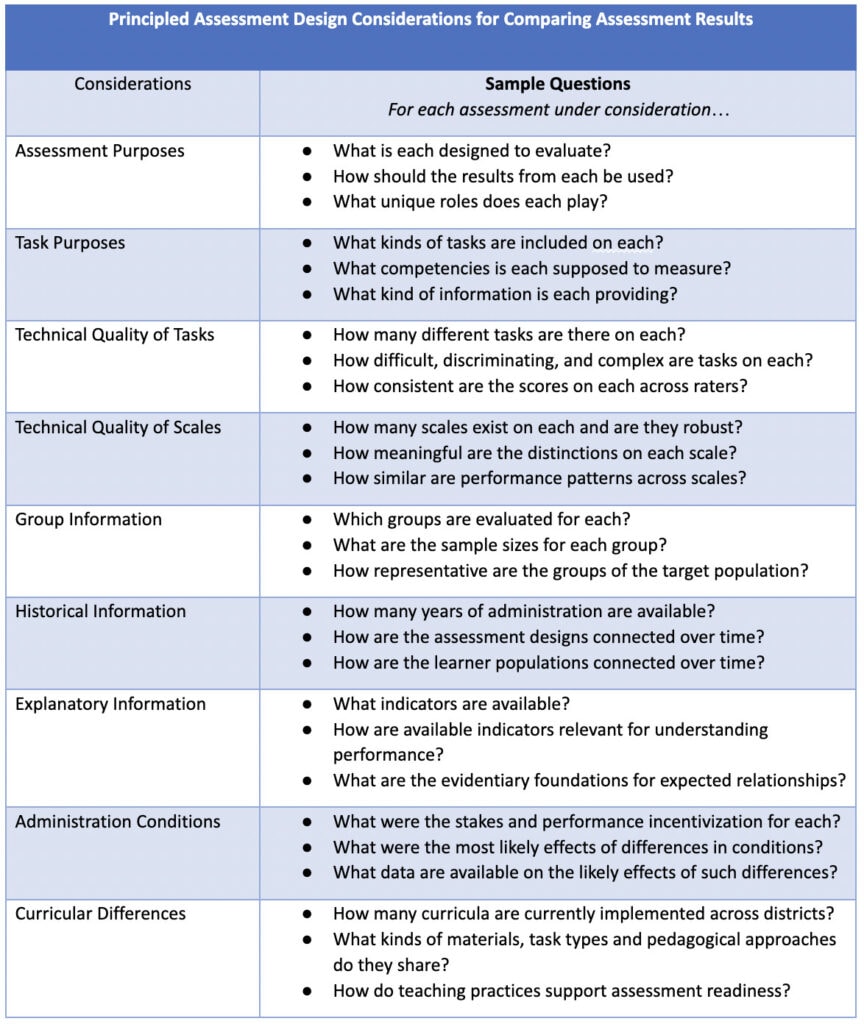
In the sections that follow I quickly review aspects of design fundamentals, technical quality, and validation information, which are also summarized briefly in the table at the end of the post.
Design Fundamentals
Assessments as Instruments
In education – as in psychology and other disciplines focused on unobservable characteristics of humans – the process of assessment is a peculiar activity. It involves reasoning backward from observable activities that learners are engaged in and the work products they produce to the kinds of skills, competencies, and metacognitive strategies they are using. This reasoning is indirect and only works because of our understanding of the purpose of an assessment and the way it is designed as a result.
In short, to make sense of and reconcile assessment information from multiple sources, it is important to have a sense of the purpose, nature, and quality of the assessment instruments, which should be evaluated with the same care as other scientific instruments.
Assessment Purposes
Purpose is probably the biggest driver for reconciling seemingly diverging narratives as it is the umbrella under which most other issues can be fit. Helping users to understand properly the different purposes of assessment is often viewed as an essential component of developing “assessment literacy”. For example, NAEP is an educational survey designed to provide coarse-grained interpretations about group-level achievement and growth over time. In contrast, benchmark assessments such as early literacy screeners are designed to determine where an individual learner is currently at in their developmental progression, and they provide this information at a much finer level of detail.
In short, to make sense of and reconcile assessment information from multiple sources, it is important to clearly understand their unique purposes first.
Nature of Tasks
Understanding the kinds of tasks that are utilized on an assessment is key to understanding how the skills or competencies, which are abstract conceptualizations backed by foundational science, are operationalized. For example, the following approaches for having middle- or high-school students engage with scientific phenomena provide very different, complementary assessment information:
Providing learners with a real-world scenario with multiple accompanying sources and then…
- asking them a variety of multiple-choice questions geared at fact-based understanding and basic comprehension of the argument in specific sources, versus
- requiring them to respond to a few short-answer questions in which they synthesize information across sources, reconcile seemingly conflicting information, and explain their reasoning in more detail, versus
- having them interact with various physical or digital tools to empirically investigate the core scientific phenomena in the scenario and translating their learnings into an argument that is presented to a panel of teachers and peers.
In short, to make sense of and reconcile assessment information from multiple sources, it is important to understand the kinds of tasks that each one contains, what these tasks ask learners to do, and what the technical quality of the information they produce is.
Technical Quality
Technical Quality of Tasks
Different assessments are developed under different conditions of best professional practice and overall quality control. An assessment such as NAEP or a mature benchmark, diagnostic, or interim assessment typically undergoes rather rigorous review cycles during design and implementation. In simple terms, assessment designers work hard to ensure that tasks produce scores that are correct, consistent, and meaningfully interpretable at various levels of aggregation; the scoring rubrics and rating procedures for constructed responses are critical for this purpose.
In short, to make sense of and reconcile assessment information from multiple sources, it is important to understand what is known about the technical quality of the tasks on each considering aspects such as cognitive complexity, difficulty, discrimination, and consistency of ratings.
Technical Quality of Scales
Different assessments leverage different methods for aggregating scores from individual tasks to create aggregate scale scores or, at least, simpler total scores. The more formalized and mature an assessment instrument is, the more attention is generally paid to the technical quality of the resulting scale scores for individuals and/or groups. Simply adding up scores from tasks because doing so is mathematically possible is not sufficient as it may not necessarily be technically defensible.
In short, to make sense of and reconcile assessment information from multiple sources, it is important to learn how scales for each were constructed, what score differences mean, and what some of their essential statistical properties are.
Group Information
Large-scale assessments typically pay a lot of attention to subgroups of students. These groups may be defined along traditional lines such as ethnicity, race, gender, or socioeconomic status, but they may also be defined according to more substantively meaningful characteristics such as different curricula or response modes. Understanding how these groups are defined and how issues of fairness and equitable treatment of these groups can be analyzed is critical for wrestling with whether the results of a given assessment can be trusted and whether it is meaningful to compare the performance of subgroups across assessments.
In short, to make sense of and reconcile assessment information from multiple sources, it is important to learn which groups are distinguished for each, how large and diverse the samples are for each group, and whether performance trends are comparable.
Historical Information
Assessment systems that have seen widespread adoption at district or state levels across the nation, including educational surveys such as NAEP, typically have one thing in common – their developers have ensured that data can be meaningfully connected across time via a common scale and that information about comparable learner populations from multiple years is available. Having such connections allows for a common descriptive red thread to be woven through the evidentiary stories about achievement status, growth, and acceleration.
In short, to make sense of and reconcile assessment information from multiple sources, it is important to learn how deep and connected the data streams around each assessment are and what kinds of comparisons can be meaningfully made for each and across.
Validation Information
Explanatory Information
To make sense of performance data from one or more assessments, supplementary data from surveys or accountability indicators is typically needed, ideally coupled with qualitative information derived from interviews, focus groups, or informal observation. This information may span the school environment proper such as when information about academic performance and socio-emotional development is connected but may also span broader community contexts such as when information about the family environment and extracurricular activities is included. Again, the quality of these data affects the trustworthiness of the interpretations that can be derived from them.
In short, to make sense of and reconcile assessment information from multiple sources, it is important to understand what kinds of data have been used to make sense of performance patterns for each assessment and whether indicators or scores with similar labels truly reflect comparable factors.
Administration Conditions
Special attention should always be paid to administration conditions, which can vary notably across assessments and have a significant impact on student motivation, engagement with tasks, and what is being learned about student competencies. For state assessments, a major issue in recent years due to the pandemic has been participation rates in state assessments and, consequently, the representativeness of the student sample that data are collected on. Reviewing secondary statistics that characterize these characteristics across time, whenever available, is essential.
Similarly, engagement with different assessments is incentivized differently. For example, since a NAEP assessment has no direct consequences for individual learners it is important for teachers and school leaders to properly contextualize it and motivate selected students to perform to the best of their abilities. Other assessments such as defenses or exhibitions of learning required for graduation carry inherently high stakes and are more likely to see students engaged.
In short, to make sense of and reconcile assessment information from multiple sources, it is important to learn about the differences in administration conditions, especially incentivization around implementation, to form hypotheses about possible differences in performance patterns.
Curricular Differences
Differences in curricula that learners across districts are exposed to affect their opportunities to learn relevant material assessed prior to administration of an assessment. It is likely the case that several major curricula used in a state across districts may share few specific resources and tasks despite that they may all be designed to help learners master similar clusters of standards.
Related to differences in curriculum, the teacher professional development practices across different districts or schools drive the ways in which students engage with materials and tasks in these curricula, how information across assessments is leveraged, and how formative classroom practices are implemented. For example, different teacher groups typically advocate different metacognitive strategies for problem-solving over others, at least to some degree, which can have important implications for how learners respond to assessment tasks and what can be learned about their capacities.
In short, to make sense of and reconcile assessment information from multiple sources, it is important to understand which curricula are used, how teachers are trained, and how each may affect how learners engage with different assessments.
Final Thoughts
The 2022 NAEP outcomes have provided a sobering look at student performance across the nation with further detailed analyses that dig deeper into correlates of performance forthcoming in the upcoming months. Reconciling what NAEP tells us about where students are with what we know from state interim and summative assessments, learning and assessment systems, benchmark and diagnostic assessments, and curriculum-relevant assessments created by districts is no easy task. It is up to district and state leaders to make relevant data available to teachers, parents, and students and to look systematically across indicators within the assessment and accountability systems to develop a coherent story about where learners are and need to go.
How are you using multiple data sources to create coherent narratives and engage with colleagues in collective sense-making?