
Tilting at Windmills: Classroom Grading Practices That Won’t Go Away

What’s wrong with bad grading practices and four ways to improve them
Sometimes I feel like I’m yelling into the void. I’ve been concerned about grading practices for more than 30 years, and now I read about South Carolina’s new law banning “grading floors.” But this post isn’t about South Carolina; It’s about ideas that won’t die despite standing on technical quicksand.
First, a quick refresher: Grading floors are policies that require teachers to assign a non-zero minimum grade (e.g., 50%) for all assignments. They’re just one of the widespread problems with grading practices, which show up in high failure rates and perpetuate serious misunderstandings about learning and student engagement.
Intuitive Test Theory
A 2004 article by assessment legends Henry Braun and Bob Mislevy, “Intuitive Test Theory,” comes in handy here. They describe the naïve theories that many people hold about testing and provide nine examples to make their case. Here are just three:
- A score is a score is a score.
- You score a test by adding up scores for items.
- 93% is an A, 85% is a B, 78% is a C, and 70% is passing.
The last one is especially relevant to my concerns. At many school board meetings and parent-teacher conferences, I’ve encountered a strong belief (an intuitive theory): that these numbers have inherent, objective meanings. They don’t. They should be seen as traditional human constructs.
Number Lines and Inordinate Weights in Classroom Grading
In a previous blog, I wrote about why the 0-100 scale is personal for me. I tried to convey my point with this simple number line, which illustrates how many more numbers fall into the F category than any other grade category. This means that a student who gets a zero on any assignment must get several A and B scores to come close to balancing out this F.
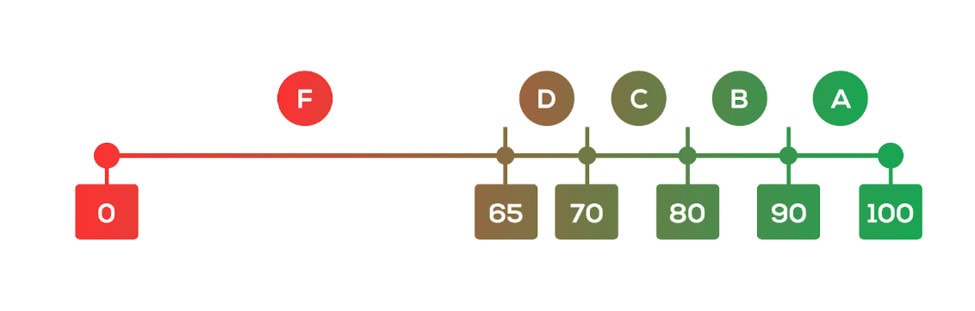
Many districts give Fs for work scored less than 60%; others set that threshold at 65%
Judging by the persistent love of 0-100 scales, this number line didn’t seem to do the trick. Perhaps an analogy will help.
Everyone recognizes that when you have kids of noticeably different weights on each end of a see-saw, the heavier kid will push their side down every time. Scores below 65 on the traditional 100-point grading scale are like the elephant in the photo below. It’s going to take a lot of kids to move that zero into balance.

Here’s a simple thought experiment to help crystallize this issue. Let’s use the traditional A-F grading scale converted to 0-4, as is done with Grade Point Averages (GPA). If a student was given an F or a 0 for a missed assignment and an A for a similarly weighted assignment, their average is a solid C (2.0). However, if the same thing occurred on a 1-100 scale, the student’s average would be 50, or a solid F. This student would need to get two perfect scores to raise their 0 to 66.7, or a solid D. That’s not fair.
I’m not opposed to zeros. They are simply a point on a number line. We can shift the number line so that -4 is the lowest score and 0 is the highest score. Of course, I’m not really suggesting that, but my point is that the specific numbers don’t matter. It’s the distance between them that matters.
Measurement specialists like to create “equal interval scales” so that the distance between any two scores should have the same meaning. It is a lofty ideal, but we should strive to produce grades such that the distance between any two grades carries roughly the same meaning about the learning a student has demonstrated.
The Imprecision of Grading Classroom Assessments
We’re very good at investigating and documenting uncertainty on large-scale tests, and we know there is a range of uncertainty for any observed (reported) score. These ranges are wider than many people would like to acknowledge.
Classroom assessments are nowhere near as precise as large-scale tests for many reasons, including differences in test length. When we investigated this uncertainty with New Hampshire’s Performance Assessment of Competency Education, a classroom assessment-based initiative, we found that it took between 12 and 15 assessments to get a stable estimate of a student’s achievement. In other words, classroom assessments are not that precise.
That’s okay, but we need to recognize these limitations. For example, there is no real difference between grades of 86 and 89, and probably between 86 and 93. (Yes, you read that right.)
Four Ways to Improve Grading Practices
Here are a few suggestions for improving current grading practices, many of which have been offered by others. Interested readers should do a deeper dive with some terrific books by Joe Feldman and Thomas Guskey (and colleagues).
- Don’t worry about grading floors.
- Stop grading everything.
- Shift to standards-based grades.
- Separate behavior and achievement.
Don’t Worry About Grading Floors
As I pointed out above, focusing on grading floors is a straw-man argument. These floors do not “give students points for something they do not deserve.” These floors recognize the reality of a simple number line. This is not a woke argument. It is a mathematical one.
Stop Grading Everything
I wrote a couple of years ago about how the proliferation of learning management systems was creating an arms race, in which more and more data were needed to report to parents. Years ago, Lorrie Shepard wrote that this push to grade everything hinders the formative learning culture we hope to see in schools. Grading formative assessments gives the impression that teachers have more data than they actually do and undermines the intended purposes of these assessments.
Shift to Standards-Based Grades
Standards-based grading, or at least the idea of it, has proliferated in recent years. In most instantiations, standards-based grades are tied to specific knowledge and skills within a larger content area (e.g., mathematics). These finer-grained reporting units are often content standards and are meant to provide parents and others with more specific information about student performance than they get from an overall content-area grade. Students are usually rated on a four- or five-point scale, whether using numbers, letters, or descriptors (e.g., meets, exceeds). Even if the lower bound of the scale is zero (rare), there are still relatively equal intervals between each of the points on the scale.
If local education leaders run into implementation challenges or parent pushback when trying to implement standards-based grading, there’s nothing wrong with going back to the traditional A-F or A-E scale. When using pluses and minuses, we end up with about as fine a distinction as classroom assessments can support. In fact, many schools and most universities still use this approach. Each assignment is graded on this A-E scale and then converted to GPA-type points to determine the final letter grade.
Either of these approaches more accurately characterizes the relative precision of the grades provided to students. Awarding fine distinctions (e.g., 91 versus 94) just doesn’t hold up against what we know about measurement error.
Separate Behavior and Achievement
I’ve heard principals and teachers say that giving students zeros for not turning in homework or other assignments teaches them responsibility, and employers want to hire responsible young people. I’m okay with that, but how would someone know the difference between a responsible student who worked really hard and earned a B and a student who got As on most of their tests but got zeros for missing some assignments? The bottom line: If you want to report on behavior, then report on behavior. Don’t conflate behavior and achievement.
More Than Windmills: Improve Grading Practices
I realize that grading is complex. It encompasses values, tradition, and implicit beliefs. While I often feel like I’m tilting at windmills, many grading issues are solvable. I hope my suggestions will lead to better practices.