
What’s in a Name? Sometimes, Quite a Bit

Considering the Effects of COVID-19 Disruptions on Identifying Schools for Supports Under ESSA
Following a two-year hiatus, states must restart their school accountability systems required under ESSA and identify schools for supports. In addition to well-documented technical concerns, states must also consider how they report accountability results, the labels they use to communicate quality to the public, and the words they use to describe performance. Do the names and labels so carefully crafted when the accountability system was developed pre-pandemic have the same meaning in spring 2022? I explore these ideas in this blog post.
What’s in a Name?
A lot of thought goes into names. Naming your child may be the first thing that comes to mind (my son’s name is the 5th in my family lineage, by the way). Boats are also a popular example. It makes me smile to recall that Boaty McBoatface was the winner of the internet’s naming contest for a research vessel. I even learned that the state of Minnesota names their snowplows (solid move, MnDOT)!
Coming up with names to describe quality is also common. People who grew up before the internet age are familiar with movie ratings using Siskel and Ebert’s “two thumbs up,” whereas younger readers may be more familiar with Rotten Tomatoes’ Tomatometer. The former is quite subjective (arguably by expert review), whereas the latter is argued to be more objective, but is really just an aggregation of subjective ratings.
Additionally, there are varied approaches to rating the quality of a restaurant. Consider the highly coveted and tightly-controlled Michelin stars, which while still based on judgmental review, are grounded in a comprehensive and rigorous review process. This system can be starkly contrasted with 1–5-star customer ratings (e.g., Yelp), which are much more subjective and quite suspect.
Often, designers assume that everyone understands what a rating scale means. In reality, a rating scale is colored by the perspective and experiences of the person who needs to interpret the rating. Whether you would eat at a 3-star restaurant or not, your 3-star and my 3-star might be very different.
In addition to establishing naming conventions to communicate quality, naming or renaming something can be equally important and difficult. Let’s consider a few professional sports teams. The Cleveland Guardians and the Washington Commanders are two recently renamed teams that had to go through a lengthy, painstaking, and public process to establish new identities despite remaining in the same location. Conversely, other teams have moved locations and maintained their teams’ names but may have watered down their identities. For example, the Los Angeles Lakers (originally from Minneapolis) and the Utah Jazz (originally and appropriately from New Orleans) can trace their names back to their roots but confuse fans as we figure out how and why they have become divorced from their original identities (I’m a Heat fan, by the way).
This same logic applies when labeling schools for high-stakes accountability. As discussed in a previous post, school ratings and labels should be based on well-defined criteria which are communicated clearly to support intended interpretations and uses. While this advice is true in a typical year, it is especially important as accountability restarts following pandemic disruptions. Understanding school performance beyond a label is necessary to inform improvement efforts.
Accountability Restarted
My colleagues recently reminded us of how the requirement to label (or differentiate) schools is just around the corner for SY 2021-2022. As we foray into restarting accountability for SY 2021-2022, it is perhaps more important than ever to unpack what we really mean by identifying a school as “in need of improvement” and determining how to support those schools to actually improve. For a detailed approach to restarting accountability, please see Restart and Recovery: Considering the Outlook for School Accountability.
The U.S. Department of Education recently provided states with guidance for SY 2021-2022. Specifically, states are required to restart accountability systems when many are still grappling with the ramifications of erratic participation rates from Spring 2021. In fact, some states and districts are dealing with near-zero participation rates from Spring 2021 assessments. Considering nearly all states use some version of growth models in their accountability systems (which require prior data from Spring 2021 to calculate Spring 2022 growth estimates), there will be several states that will face persistent challenges even if participation rates this spring return to normal.
Accountability systems are a valuable tool in sending signals associated with state policy goals and can help schools that need the most support, whether comprehensively or targeted to a specific set of students or student groups. But even under normal circumstances, the labeling of schools is a somewhat blunt application of accountability systems that are based on lagging outcome measures that may take time to adjust (i.e., more than a single academic year). Couple this challenge with the likelihood that pandemic recovery will be a multi-year issue, we need to turn to other data that can guide improvement efforts throughout the year and that those efforts can be realized in end-of-year outcomes.
Providing Finer-Grained Information by Expanding the Use of School Performance Profiles
Recently, Chris Domaleski discussed the value of using performance profiles to identify schools. Performance profiles prioritize certain indicators over others using a series of decision rules that “explicitly defines which configurations of performance across indicators, or performance profiles, are valued.” They force accountability data consumers to look at how the combination of indicators or data elements leads to a specific label.
Performance profiles can be a powerful tool for unpacking signals of school quality in accountability systems and understanding what’s in a name. However, these performance profiles rely on ESSA-required outcomes and do not provide much insight into the next logical step for improvement.
I believe that the use of performance profiles can also be applied in a more formative (evaluation) sort of way rather than simply using them for summative determinations (i.e., summative evaluation) under ESSA.
I argue that we need to extend the use of performance profiles beyond big “A” accountability and apply them to build performance profiles that include coherent leading and contextual data elements. This recommendation is particularly relevant for those states with lower-than-typical participation rates from Spring 2021 and could address some of the systematic data missingness we’ve seen in schools throughout the pandemic.
Building a Coherent School Data Profile
It’s not enough to have clear criteria or decision rules to describe school performance—context matters. However, context is difficult to describe using big “A” accountability alone, as it relies solely on outcomes or lagging indicators. Furthermore, accountability-based lagging indicators rely on complete, consistent, and practical data that needs to be generalizable (see D’Brot, Landl, Domaleski, & Brandt, 2020). This generalizability is threatened by systematically missing data.
How can we mitigate – or least be more honest about – the impact of missing data? Answering this question is why ideas like building a measurement infrastructure and identifying coherent data elements that logically connect to accountability indicators become so important.
I’m not advocating for states to step into the role of LEAs and schools and attempt to drive deep support (outside of the focus of CSI schools). But states do have the vantage point to identify those schools that are making progress and developing resources that frame accountability systems as an endpoint set of data that require earlier indicators to monitor progress. This is a topic that has been raised by many since school improvement has become a marketed commodity.
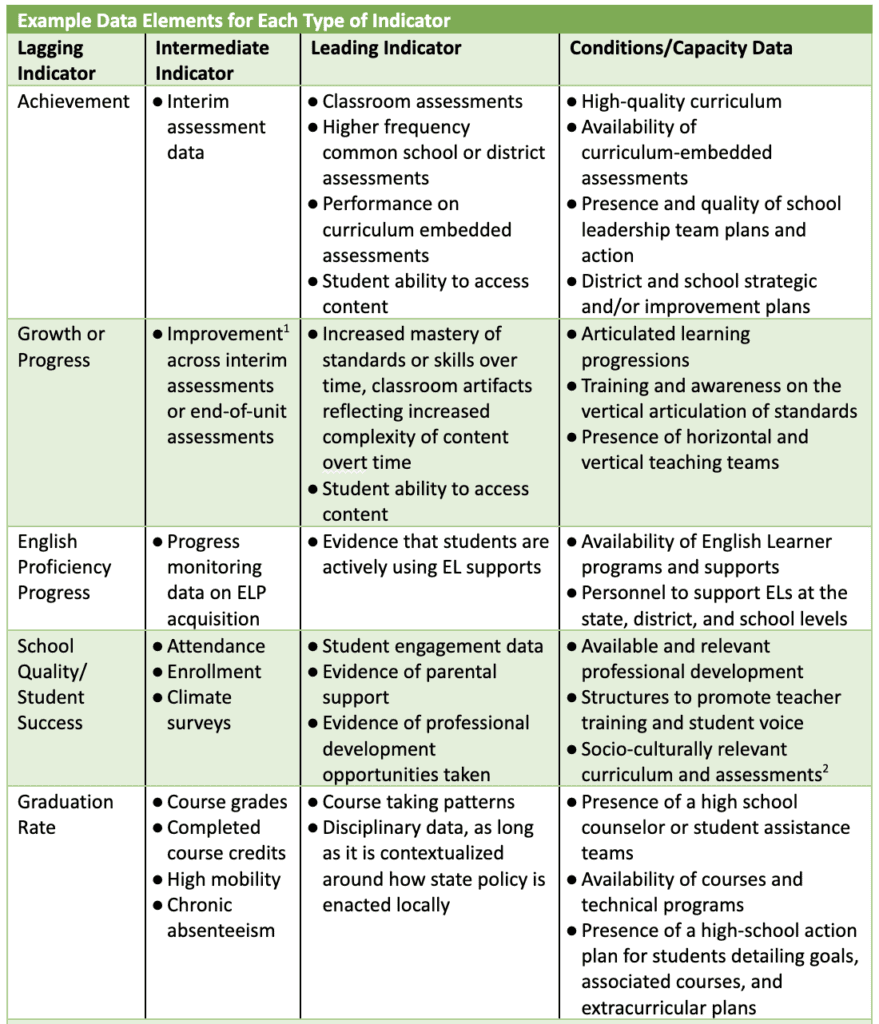
In the table below, I offer a few suggestions that are informed by previous work and others’ work in the Opportunity to Learn (OTL) space (see Marion, 2021). These suggestions are organized as lagging indicators, intermediate indicators, leading indicators, and conditions/capacity data:
- Lagging Indicators (i.e., outcome indicators): These are the current accountability indicators and their corresponding data elements that make up the overall school ratings (or dashboard). Lagging indicators tell us whether the intended result was actually achieved.
- Intermediate Indicators: These are data elements that are closely related to outcome data but may not be appropriate or ready for high-stakes use. They help inform progress toward achieving intended results on lagging indicators.
- Leading Indicators: These are the data elements that inform progress against intermediate indicators. They may not be collected at the state level but are important to identify as they are more forward-looking and can help predict future performance.
- Conditions or Capacity Data: These refer to the conditions that support learning or are indicative of capacity among personnel, an organization, or procedures that can support progress on longer-term outcomes. Without the necessary capacity or appropriate conditions, leading, intermediate, and lagging indicators will suffer.
The following table provides examples of data elements for each type of indicator that can potentially serve as a starting point for collection, discussion, and comparison:
2. See Evans (2021). A Culturally Responsive Classroom Assessment Framework: The Intersections of Equity, Pedagogy, and Sociocultural assessment.
Recognizing the Limits of Large-Scale to Capitalize on the Small-Scale
The table above lays out some ideas about how data may be linked over time (i.e., immediate to short-term to long-term). However, data will still need to be disaggregated to understand how individual student groups, grades, or even classrooms are performing. Disaggregation of data can lead to greater insights in the intermediate, leading, and capacity-based data elements.
As I mentioned before, we need to understand the blunt nature of accountability-related data and that progress occurs slowly. A benefit of that bluntness is that it can spur confidence in the claims we make when schools make progress (or stall). The small-scale data presented above are where the change can actually occur more quickly.
By identifying what data are coherent, valuable to you, and available, we can begin building performance profiles focused on continuous improvement that can be measured, monitored, and improved upon – and that also have more direct connections to the initiatives we may be implementing. Perhaps more specifically, a more robust set of data that extends beyond lagging indicators will support improved clarity, context, and communication to help us overcome the limitations of using coarse labels to understand and address school performance.