Recovery, Stabilization, or Continued Decline as We Emerge from the Pandemic


Reporting 2022 State Assessment Results to Allow Accurate Comparisons
If analyzed and reported thoughtfully, 2022 state assessment results are a critical tool for evaluating learning recovery efforts and understanding where students are in terms of making up lost ground as we emerge from the pandemic. But this promise can be realized only if the correct information is presented in ways that allow accurate comparisons.
At the Center for Assessment, we have been closely following the release of this year’s state test results. After all, this is our first chance to see if students are starting to climb out of the deep academic hole after up to two years of remote, hybrid, and otherwise interrupted learning. Unfortunately, we have seen reports from many states where not enough information is presented to understand where students are in their education.
Most reports in 2021 – but not all – at least mentioned the proportion of students testing. Further, many states used methods that we and Andrew Ho put forward to account for these differential participation rates. As we (Keng, Boyer, Marion, 2021; Betebenner et al., 2021) and colleagues (Ho, 2021) have been pushing for the last two years, analysts need to account for the partial and changing groups of students participating in testing to make sense of the aggregate scores.
However, just because most states are back to 95% participation rates in 2022 does not mean we can forget about reporting the sample characteristics and other aspects of the context of testing.
Comparing 2022 State Test Results to Previous Years
Are any of the recovery efforts working? Are some working better than others? How do we know? Those who rely on state test information to help answer those questions are interested in two primary comparisons.
First, comparing scores this year (2022) to last year (2021) can shed light on the degree to which challenges to learning have stabilized and are hopefully recovering. Many states with which we partner are showing signs of stabilizing and beginning to show signs of recovery.
Second, we must compare the 2022 assessment results to the 2019 scores to evaluate the progress of students (and the adults supporting them) in getting back to where they were before COVID upended schooling. As we and many others have reported, 2021 test scores were quite depressed compared to 2019.
We spent a lot of time and energy last year ensuring that the comparisons of 2021 to 2019 were as valid as possible because of the two-year gap and, more importantly, because of lower-than-normal participation rates in 2021. Further, we had good evidence that the non-participants were a non-random subset of the enrolled students. Leslie Keng created the following graphic (with input from Andrew Ho) to illustrate this issue.

This figure portrays the 5th-grade students tested in 2021 as the green and blue stick figures. The red stick figures, labeled Type 1 students, represent students tested in 2019 as 3rd graders who were not tested in 2021 for various reasons (e.g., not enrolled in 2021, quarantined during the test window, parent opt-out). The blue stick figures represent those students tested in both 2021 and 2019 and serve as the basis for our comparative analyses. The green stick figures represent students who were tested in 2021, but we did not know how they performed previously. On the other hand, we did not have 2021 data for the Type 1 students, but we could employ a range of statistical techniques to estimate the performance of these students.
Additional Information is Needed Even If Almost All Students Are Participating in State Testing in 2022
Most of the press releases we have seen this year either do not mention the characteristics of the students participating in state testing or simply say that test participation is back to normal. Unfortunately, when comparing 2022 test results to 2021, we still have the same problem of comparing apples to oranges, with almost full participation in 2022, but only partial and non-representative participation in 2021. Further, anyone reading about education over the past couple of years knows that overall enrollment has declined considerably since the onset of the pandemic.
Without considering the differences in student samples between the two years, inferences about recovery, stabilization, or decline may not be accurate.
Therefore, to help users get a more accurate picture of student achievement, we suggest that all score reports this year include the number of students enrolled, and the percentage of those students who participated in testing, and provide the same relevant information and scores for 2021, and 2019. We acknowledge that achievement comparisons to 2019 are becoming less relevant as time marches on, but we argue this information is appropriate for at least this year.
We created the following template as an example of how this information could be reported for each grade level by content area. To better understand the potential influence of differential participation in 2021 and 2022 results, the differences in enrollment and participation must be disaggregated by all relevant demographic groups.
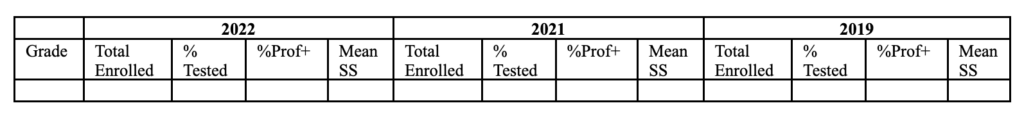
Content Area (e.g., Mathematics)
Longitudinal Analyses
Our focus thus far has been on the typical state achievement reporting for all students in each tested grade, where the results are reported for different students each year (e.g., this year’s 4th graders are different kids than last year’s 4th graders). On the other hand, longitudinal analyses compare the performance of the same students across years (see Carlson’s 2002 paper for a terrific explanation of these different metrics). These analyses provide a much clearer picture of whether student learning – for the same students – has returned to pre-pandemic normal, is accelerating beyond pre-pandemic normal – allowing students to catch up – or is continuing to decelerate.
One approach to longitudinal analyses is to examine the performance of the three categories of students in Figure 1 above. State assessment professionals and their assessment partners can quickly expand Table 1 to include additional performance information in the table for each of the following students:
- Type 2 students: 2019, 2021 and 2022
- Type 3 students: 2021 and 2022
- Type 1 students: 2019 and 2022
This additional breakdown, of course, can only be done for each type of student for which we have 2022 assessment data. Achievement information for each of these student types should provide insights into the academic achievement of these broad subpopulations of students that could point us to areas for further investigation.
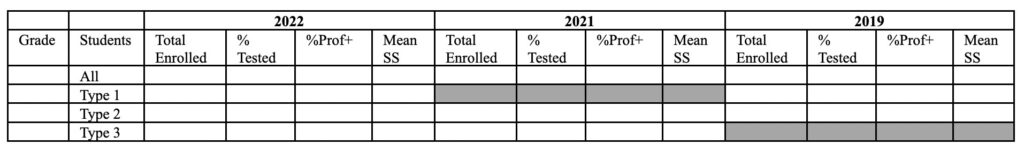
Content Area (e.g., Mathematics)
Measuring and Reporting Growth
Damian Betebenner and his colleagues at the Center have been employing “baseline-referenced” student growth percentiles (SGP) that allow for comparing student growth rates against pre-pandemic growth rates. This is like characterizing milk’s current 2022 cost in 2019 dollars. Using both statistics will enable stakeholders to judge learning progress against last year’s assessment results and against historical rates of achievement. Growth results are less likely to be affected by changes in the proportion of students testing than achievement results because individual students are matched across years. However, the changes and enrollment must still be considered. Thus, we recommend including similar information as we did for achievement results, as seen below. Note that the baseline SGPs were established using growth from 2017 to 2019 or 2018 to 2019, depending on whether growth is being computed for 2021 or 2022, respectively.
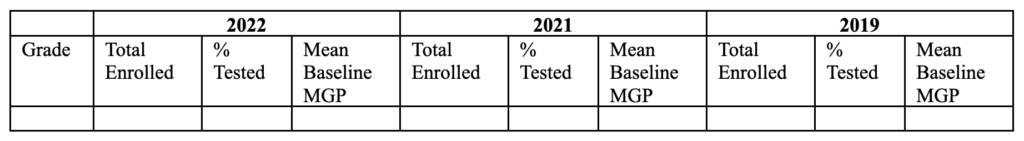
Content Area (e.g., Mathematics)
We offer our recommendations for reporting results in 2022, because honest and transparent reporting is necessary to help educators, policymakers, and parents understand the degree to which students are starting to recover from interrupted learning. To support valid interpretations of score trends, stakeholders need the same information about the students that was necessary in 2021. When comparing 2022 assessment results to 2021, the differences in populations of students participating in the test must be portrayed and evaluated.
NAEP is Coming
Finally, we note that state-level NAEP results will be released in October or November. NAEP’s sampling approach will ensure that the test results in 2022 can be validly compared to the last time NAEP was administered in 2019. NAEP will provide a clear look at the effects of the pandemic on student learning and will facilitate comparisons across states and student groups.
RILS is Coming, Too!
The Center’s annual conference, The Reidy Interactive Lecture Series (RILS), will be back in person this year in Portsmouth, NH on September 22-23, where we will elaborate on how we can best use assessment to understand the impact of the pandemic on student learning, as well as monitoring and supporting recovery.
In addition to discussing the role of statewide assessment as we have in this post, our colleagues and outside experts will explore how formative assessment and other aspects of assessment and accountability can be used to help students and schools recover from this devastating pandemic. You can learn more about the conference and register here.