Comparisons Matter: Considering What Recovery Is

Now is the Time to Begin Preparing for the Reporting of Spring 2022 Assessment Results
The question about the pandemic impact has largely been answered – it’s bad (e.g., Betebenner et al. 2021). In many cases, really bad. With Spring 2022 assessment – and the subsequent assessment results – on the horizon, the question looming is now “are students recovering”? Answering this question requires (1) determining what recovery is and (2) judging whether students are actually recovering.
The answers to these questions have consequential implications for how we communicate about student learning, and thus recovery. Consider two hypothetical headlines that could emerge based on Spring 2022 results:
- Schools continue to struggle: 2022 6th graders still not doing as well as 2019 6th graders
- School are back on track: 2022 6th graders doing better than 2021 6th graders
These headlines provide more nuance than would typically be found in a newspaper headline, yet obviously still are not nuanced enough. Both of these headlines could both be true given the same Spring 2022 assessment results, but neither necessarily enhances public understanding about whether students are actually recovering.
The message that we want to convey about recovery should shape the way we frame comparisons, at least in part. Does “recovery” mean returning to pre-pandemic levels of performance (“Schools continue to struggle”)? Does “recovery” mean improvement from last year (“Schools are back on track”)? Does “recovery” mean both of those things, and more? Of course it does.
So, how do we communicate that message effectively?
Finding the Right Comparisons for Spring 2022 Assessment Results
Last year, the comparison was straightforward. Most states compared Spring 2021 results to Spring 2019 results, and in rare instances looked back prior to 2019. This year, considering Spring 2022 results involves the additional complexity of needing to take into account both pre-pandemic (i.e., 2019) and “during” pandemic (2021) data.
One way to consider these distinctions is through hypotheticals. My colleagues Betebenner & Wenning (2021) proposed comparing actual student performance (i.e., the pandemic reality) to the performance a student would have had if the pandemic had not happened (i.e., the non-pandemic reality). In the figure below, Betebenner and Wenning sketch out impact in terms of four trajectories of student performance in sixth grade during the 2020-2021 school year.
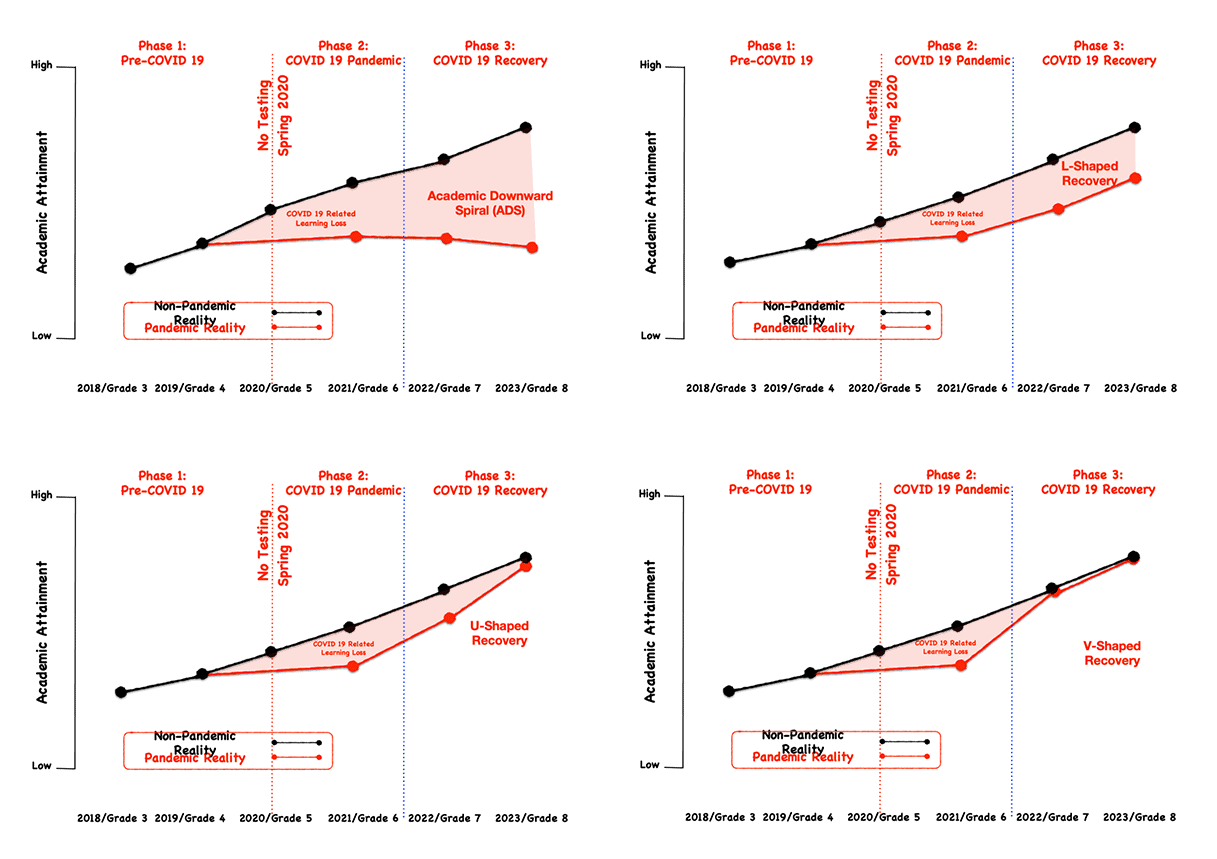
The top left panel realizes our worst fears about student academic attainment moving forward – an Academic Downward Spiral (ADS) in which students continue to lose ground. In the top right panel, an L-Shaped trajectory, students make progress from 2021 but never recover from the initial impact of the pandemic. The bottom two panels, U-shaped and V-shaped trajectories, reflect a more positive outcome than either the ADS and L-shaped trajectories, in which student academic attainment quickly or slowly returns to pre-pandemic levels.
Determining whether students are experiencing any or all of these trajectories requires multiple years of data. The Spring 2021 assessment results have set the stage and the stage is bleak (again, see Betebenner et al. 2021).
Looking ahead, a state’s first task with regard to communicating about the recovery is deciding where to place Spring 2022 results. Betebenner and Wenning optimistically placed Spring 2022 in “Phase 3: COVID-19 Recovery”. Would it be more accurate to place Spring 2022 results as a second data point in “Phase 2: COVID-19 Pandemic”? The correct answer may be somewhere in between and it vary across and even within states, but depicting it accurately will be a critical component of communicating effectively about the recovery.
Now, let’s return to our original questions.
What is Recovery?
What do we mean when we say recovery? Is it an immediate return to pre-pandemic performance (i.e., the V-shaped recovery)? Unlikely, but if so, our primary point of comparison is 2019, which is similar to many of the comparisons conducted on Spring 2021 data. However, in many cases, such a return will require levels of unprecedented growth. So, overly focusing on just 2019 may paint a picture that negates the progress we have made. On the other hand, it is unlikely that we are seeking to understand recovery just in terms of our current or ongoing pandemic or post-pandemic reality, in which we would compare Spring 2022 results only to 2021.
Ultimately, we think that each comparison holds value and the matter is essentially one of emphasis – what comparison matters more? What should the headline from the SEA be?
Are Students Actually Recovering?
So, what do we say about these hypothetical students, now seventh graders in 2022, and their recovery?
Unfortunately, an important part of messaging Spring 2022 results is going to be effectively communicating that one “post-pandemic” data point is not enough information to answer that question. Unless the Spring 2022 results show a V-shaped trajectory (unlikely) or clearly reflect an Academic Downward Spiral (hopefully unlikely), we will not have enough information to conclusively determine whether we are seeing the beginning of an L-shaped or U-shaped trajectory or even an ADS.
Given this uncertainty, states should:
- Define Recovery. Clearly define what recovery means, in easy to understand terms, and use that consistently throughout communication.
- Review Prior Messaging. Review prior communications about the impact of the pandemic, and in particular how impact has been quantified, and then determine whether messaging in 2022 will be a continuation, or revision of, the messaging in 2021.
- Consider Learning Acceleration Efforts. Determine what can and should be said about the impact of learning acceleration efforts. An unpredicted level of federal funding has been allocated to education and the public will want to know if those dollars have been well spent. Even if interventions are implemented at the local level, states can play a key role in disseminating information on what is being done and how well it is working.
- Consider the Role of Other Data. Assessment results alone do not tell the whole story about recovery, or lack thereof. Clearly, student socio-emotional well-being can and should be attended to in communicating about a pandemic. Even more distal measures of student well-being and learning (e.g., enrollment and attendance data) can be valuable and allow us to understand whether some students are in, or at risk of, an Academic Downward Spiral or an L-shaped trajectory.
These recommendations are ordered in terms of importance – if a state does nothing else, it should clearly define what recovery means and use that definition consistently. Building on this definition of recovery is also an understanding of how long it might take to recover, which in many cases will be a multiyear endeavor. Without a clear definition of recovery, messaging can be muddled, stakeholders can get confused, and ultimately the importance of messages around recovery could be lost. And given the impacts from Spring 2021, understanding recovery, and subsequently supporting continued recovery, are paramount.
Finally, it is not too soon to begin considering the definition of recovery. If the past two years have taught us anything, it’s that it is never too early to start planning.